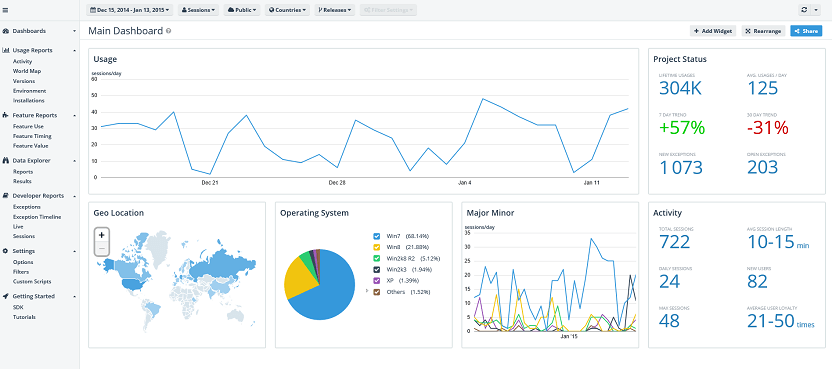
One important thing to remember is that Analytics will not magically analyse your app by itself, but it is more of a tool that lets you ask the questions and get the answers without bothering your customers.
In this article, we will use Telerik AppBuilder to create a NativeScript app and connect it with a Telerik Platform Analytics project.
Please note that everything that we do in AppBuilder can be done from the Command Line Interface.
If you don’t have an account yet, you can create a 30-day trial, which should be more than enough to try the Analytics component.
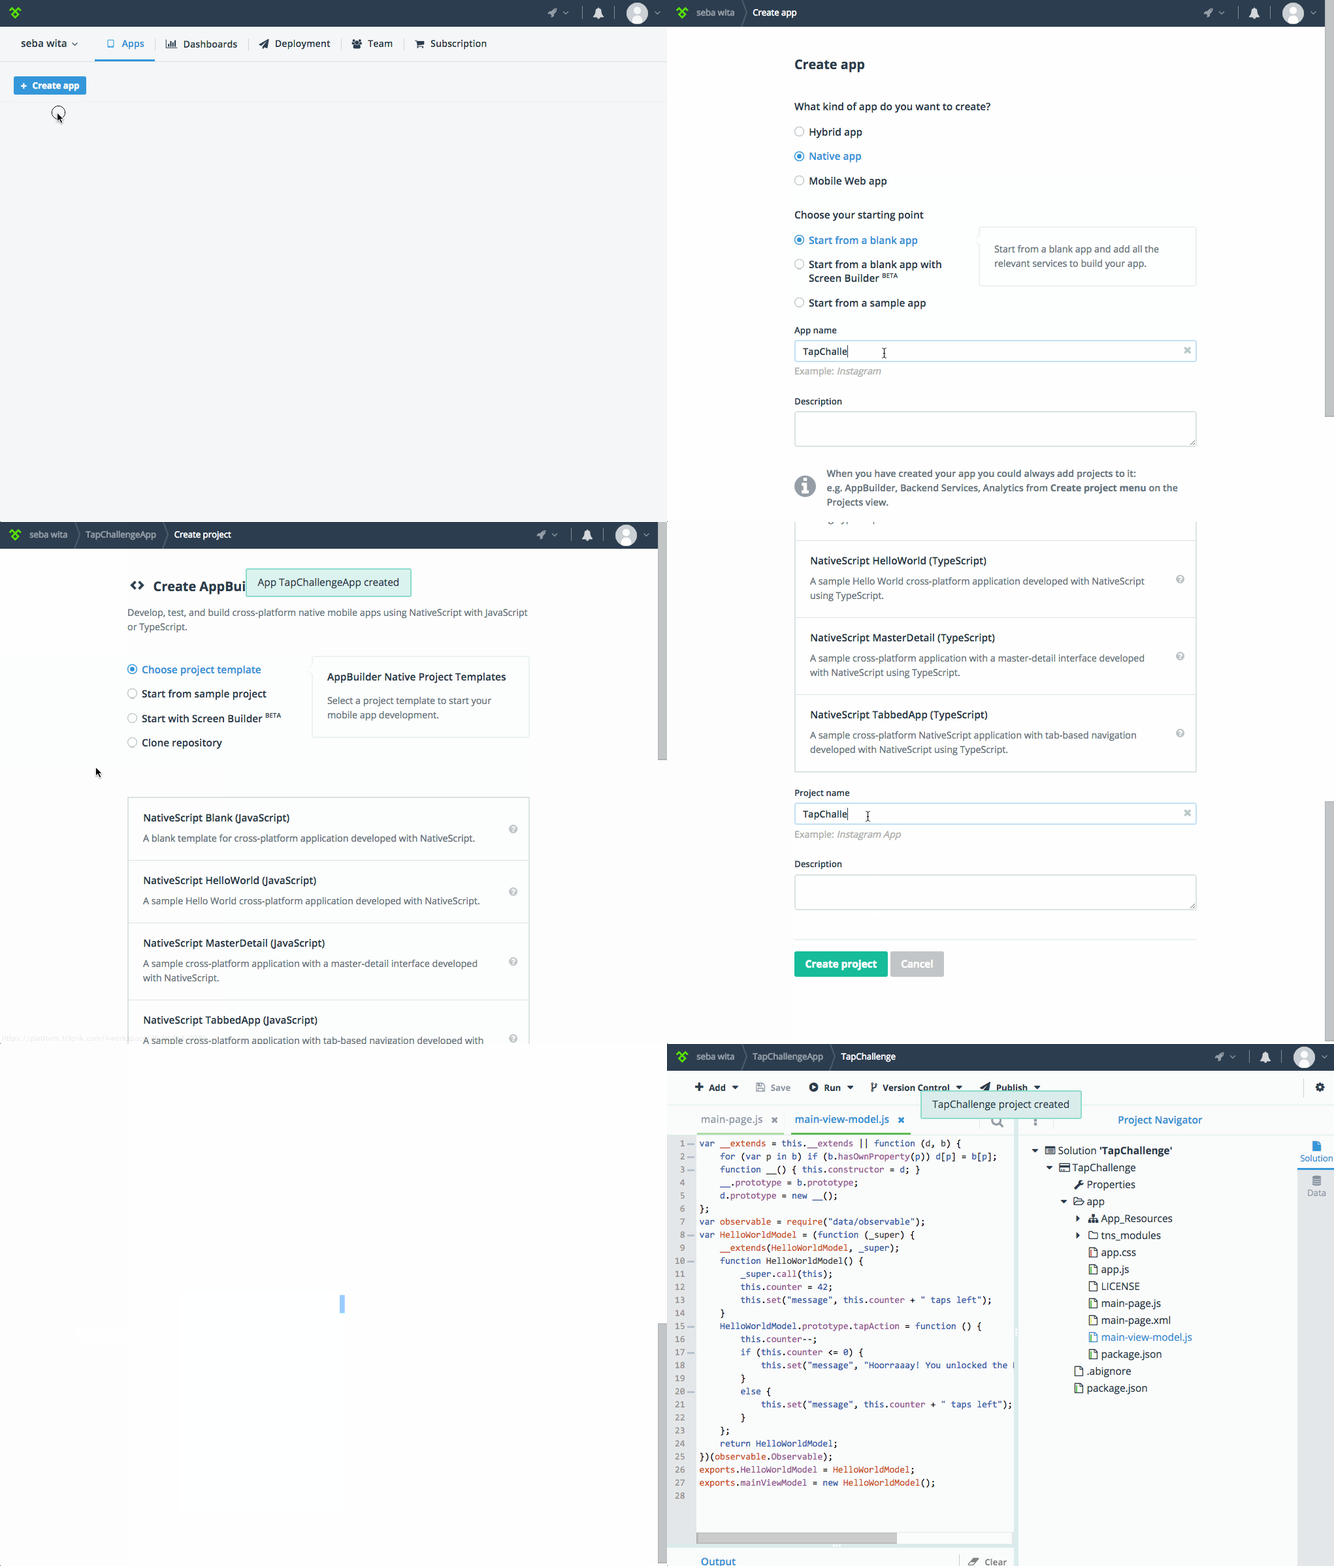
Please note the generated code snippet, which already contains this Analytics productID, which enables the SDK to send your analytics data in the right place. Make a copy of the productID, as we will use it later on.
Go back to the TapChallenge AppBuilder project (just click TapChallengeApp in the top right corner and then select TapChallege).
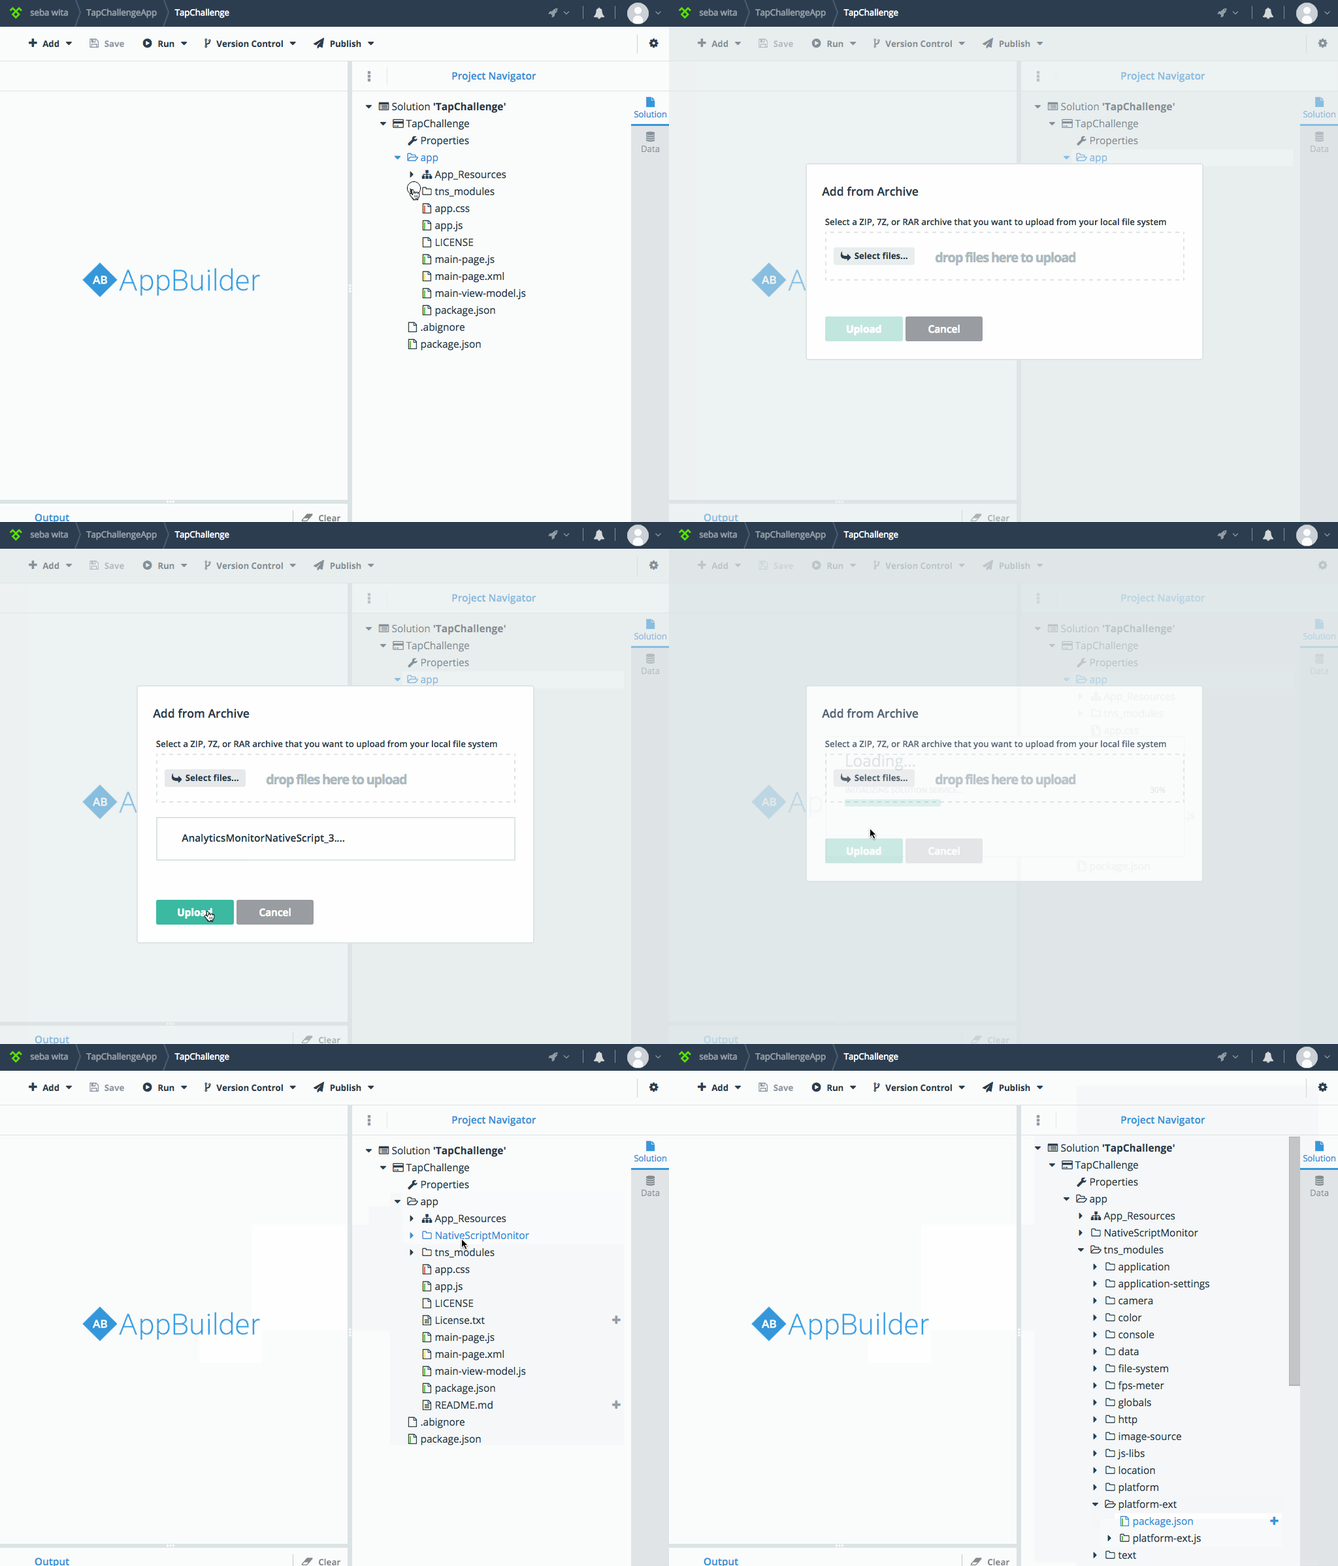
It is best to keep both projects open in two separate tabs, as you will be asked to switch between TapChallenge (the AppBuilder project) and TapChallengeAnalytics (the Analytics project).
If you lose track of either, just right-click TapChallengeApp (in the top left corner) and choose to open it in a new tab. Once TapChallengeApp open, you can switch to whichever project you need to work with.
The {N} Hello World app already contains a button and a counter, which counts down from 42 to 0 every time the button is tapped. <spoilers> Once 0 is reached, the user is presented with the following message: “Hoorraaay! You unlocked the NativeScript clicker achievement!” </spoilers>
We will add Analytics around this functionality to see what sort of things are possible.
Now that all projects are in place and we have imported the Analytics module, we are ready to start coding.
Switch to the TapChallenge tab.
Open app->app.js and paste the below code just before application.start().
This adds a monitor object to your app, which lets you capture app usage analytics.
application.on(application.launchEvent, function (e) {
var NativeScriptMonitor = require('./NativeScriptMonitor').Monitor;
var monitor = new NativeScriptMonitor({
productId: 'your product key in here',
version: '1.2.3'
});
monitor.start();
global.monitor = monitor;
});
application.on(application.exitEvent, function (args) {
monitor.stop();
});
Update the productId with the one you copied from TapChallengeAnalytics -> SDK -> code sample.
Now you should be able to build the app and test it on your device.
If the app runs, we are ready to go.
Even though we haven’t done much, the Analytics project should soon contain some data about your device, location and app version. Just give it 5 minutes to catch up.
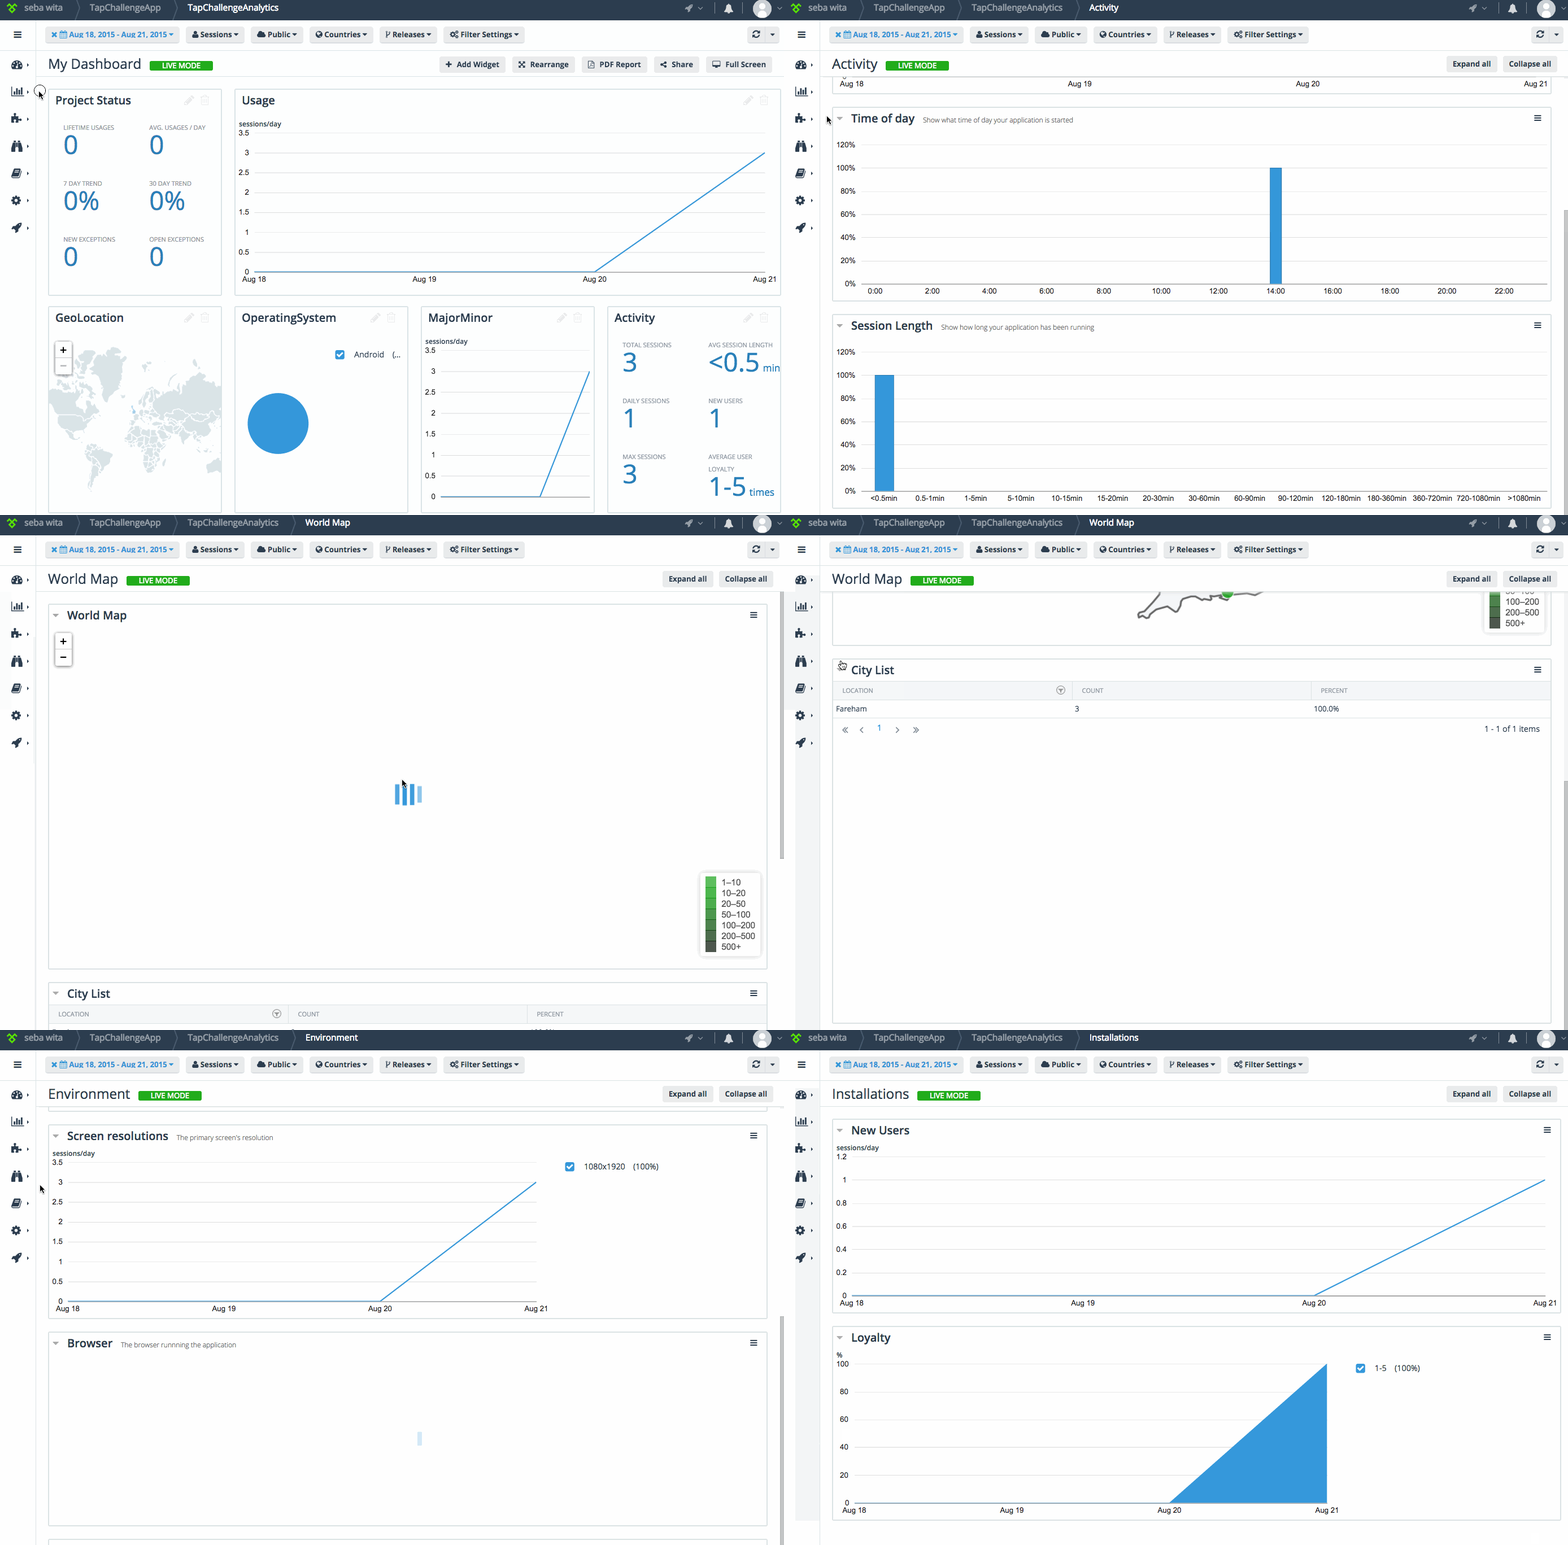
Switch to the TapChallengeAnalytics tab, enable Live Mode (see below for instructions) and prepare to be amazed :).
Note that by default the reports show data for the previous four days. This is excluding the current date. Which means that the default settings won’t show your recent interactions.
To change that, click on the date (top left corner) and select Live Mode. This will allow you to see the current usage.
When reviewing your data, keep in mind that there is always a few minutes delay between what was recorded on the device and what appears in the project.
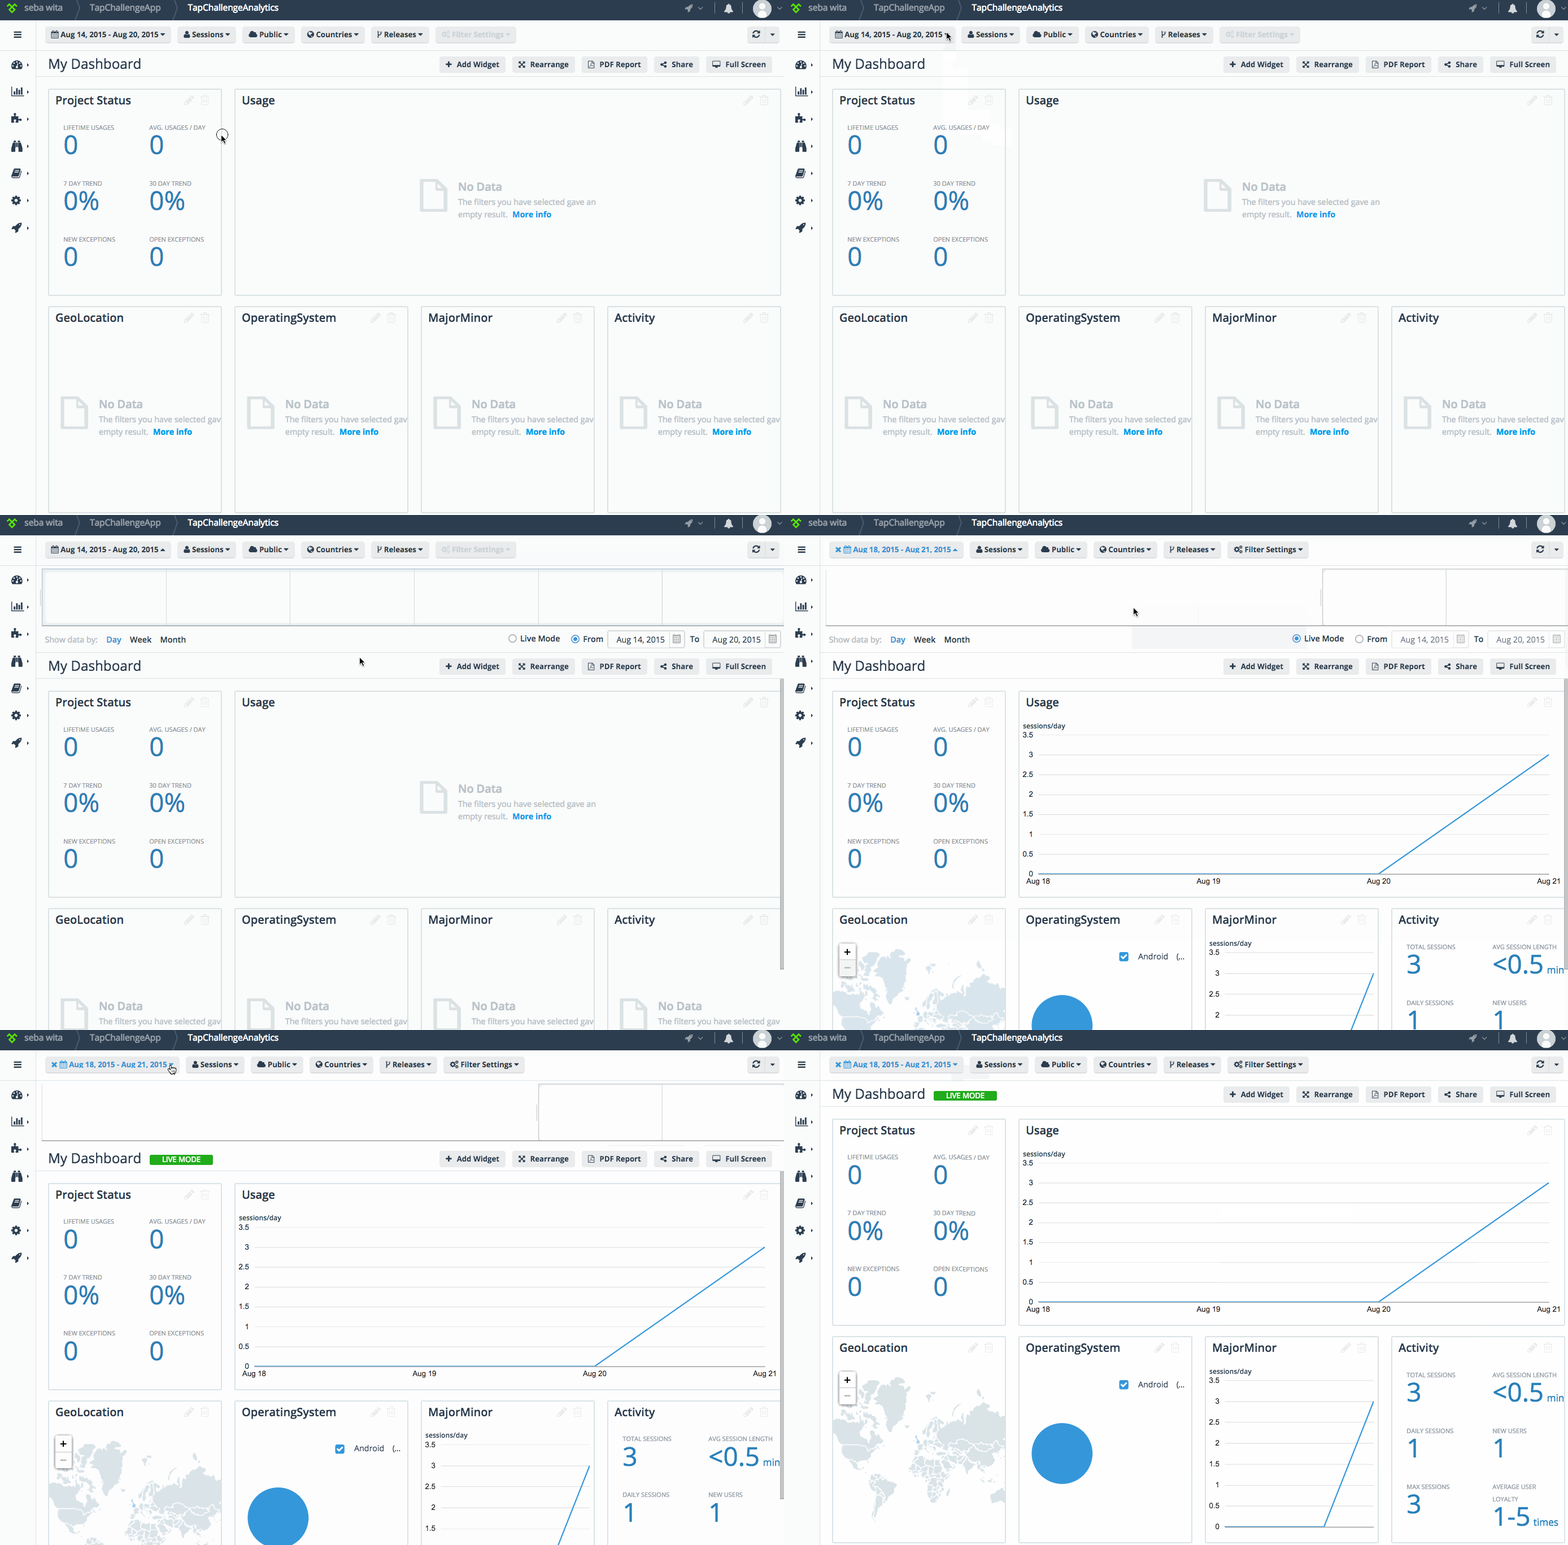
This section of the Analytics project is a generic report that provides you information around who, where and from what device is using your apps.
Now it is time for us to start asking questions. To see if, how often and which features are used the most.
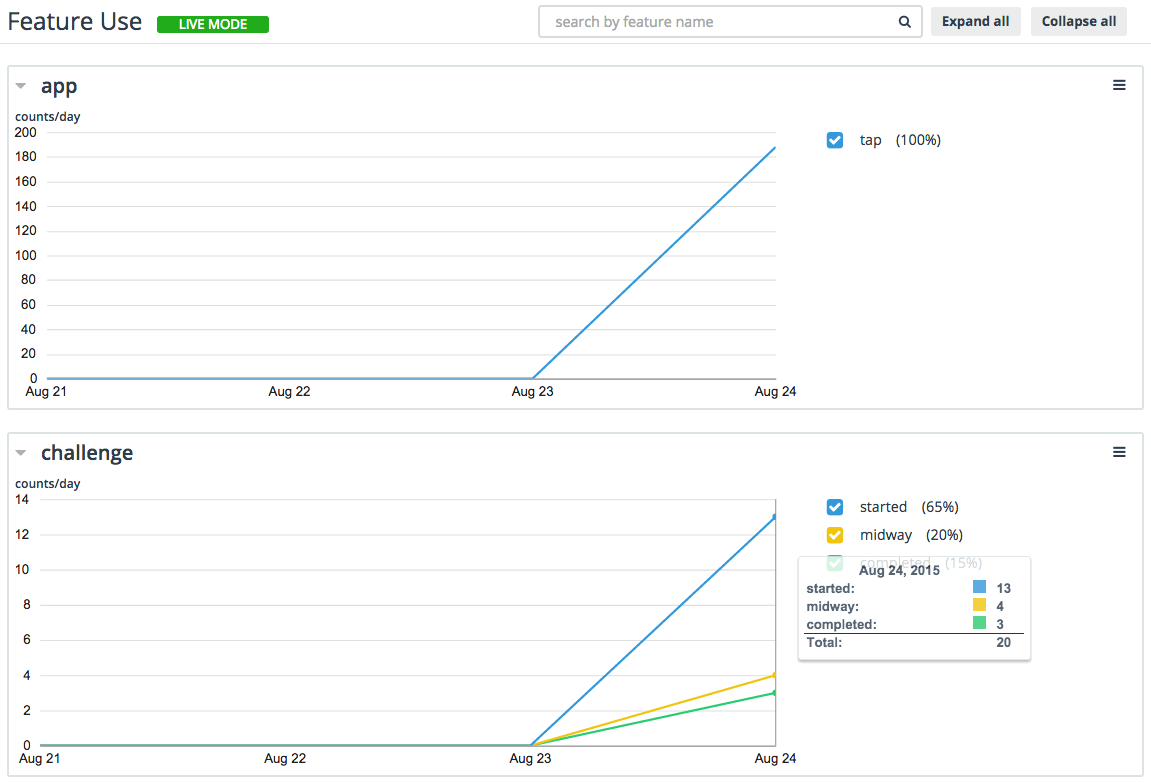
This is as easy as calling monitor.trackFeature("featureName");
So for starters let’s record the tap event.var monitor = global.monitor;
var monitor = global.monitor;To get a bit more info about the user patterns, we can capture how many people start, get to the middle and finish the 42 taps challenge.
Just add the following code after the first trackFeature call:
switch (this.counter) {
case 42:
monitor.trackFeature("challenge.started");
break;
case 22:
monitor.trackFeature("challenge.midway");
break;
case 1:
monitor.trackFeature("challenge.completed");
break;
}
Redeploy the app for the changes to take effect (I assume that you are using LiveSync to aid you with that). Then run it a few times.
Switch to the TapChallengeAnalytics tab. Go to Feature Reports->Feature Use and check the reports (you still might need to wait around 5 minutes to start seeing the results).
As the next step we can enhance feature tracking with a value, to allow us to see the conditions under which the event happened.
This is quite easy, just call monitor.trackFeatureValue("featureName", value);
Let’s start by capturing the info around when the app is used.
Switch to the TapChallenge tab and open main-view-model.js.
Add the following code inside function HelloWorldModel() {
var d = new Date();
var hour = d.getHours();
monitor.trackFeatureValue("favourite.Hour", hour);
It should look as follows:
function HelloWorldModel() {
_super.call(this);
this.counter = 42;
this.set("message", this.counter + " taps left");
var d = new Date();
var hour = d.getHours();
monitor.trackFeatureValue("favourite.Hour", hour);
}
Redeploy the app and run it a few times. Just to get different values, you could change the time on your device or change the hour via code.
Switch to the TapChallengeAnalytics tab. Go to Feature Reports->Feature Value.
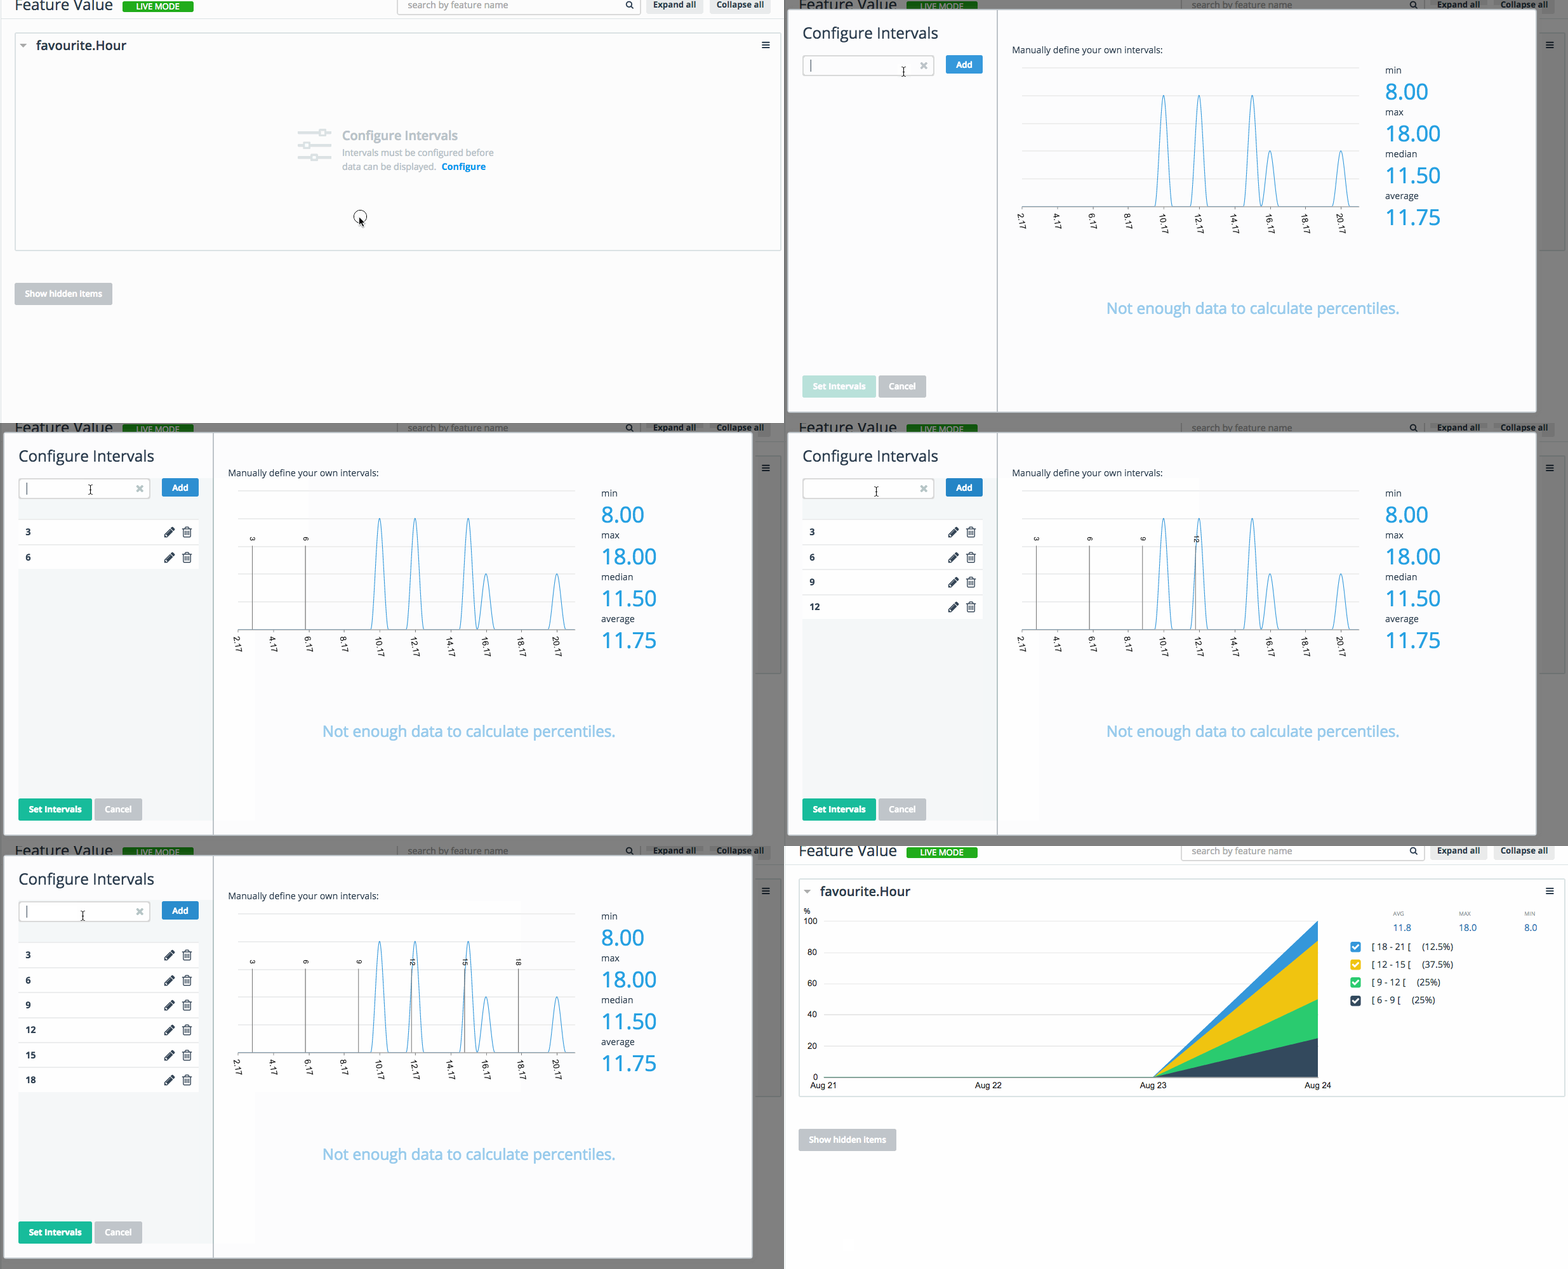
By default, the Value based reports do not display any stats. You have to configure them, by configuring intervals.
Expand the favourite.Hour report. Click Configure. In the text box on the left type 3 and click Add. Do the same for 6,9,12,15,18 and 21. When done, click Set Intervals to generate a brand new report.
The final technique is time-based feature tracking. It can be used to measure how long it takes for a process to complete, or how long it takes for the user to respond or complete a task.
Time tracking is made of 2 function calls: monitor.trackFeatureStart("featureName"); and monitor.trackFeatureStop("featureName");
Switch to the TapChallenge tab.
Let’s update our switch statement in main-view-model.js to measure how long it takes for users to complete the challenge.
switch (this.counter) {
case 42:
monitor.trackFeature("challenge.started");
monitor.trackFeatureStart("userSpeed.challengeComplete");
break;
case 22:
monitor.trackFeature("challenge.midway");
break;
case 1:
monitor.trackFeature("challenge.completed");
monitor.trackFeatureStop("userSpeed.challengeComplete");
break;
}
Redeploy the app and try to complete the challenge a few times.
Switch to the TapChallengeAnalytics tab. Go to Feature Reports->Feature Timing.
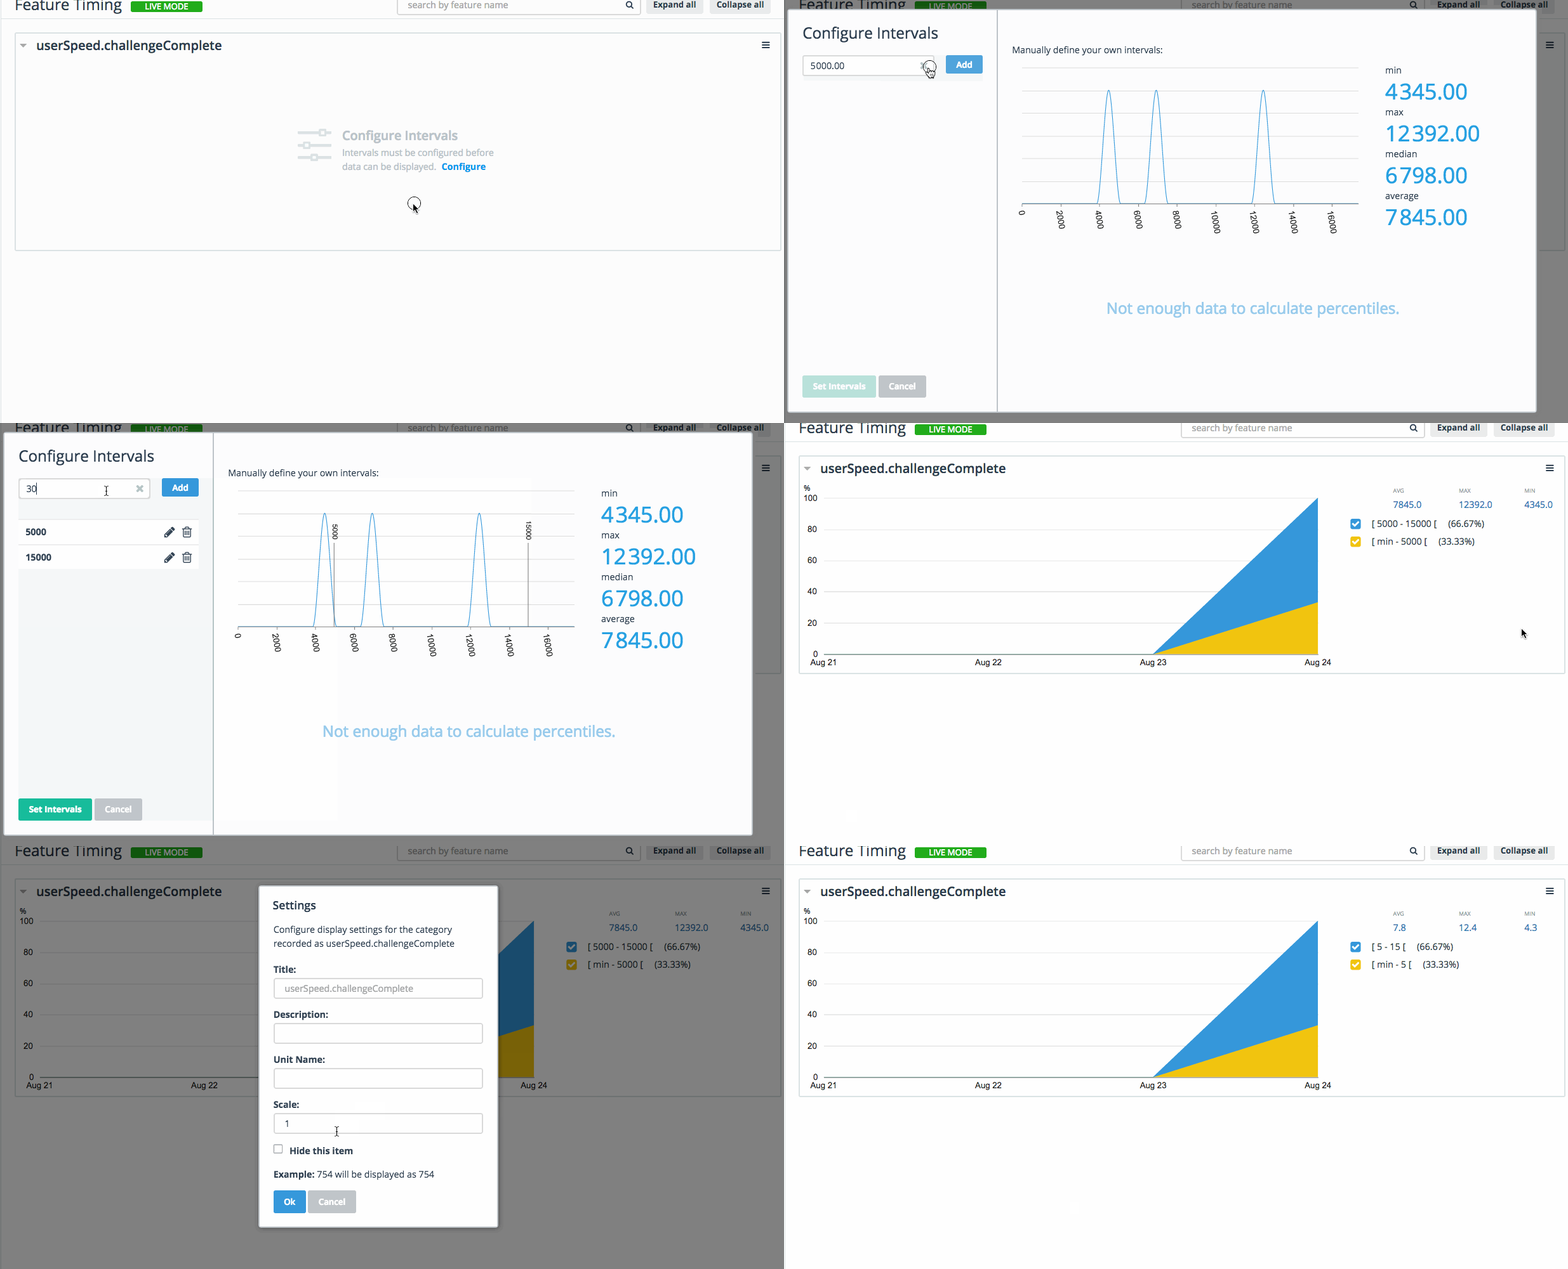
And just like with value-based reports, you have to configure the intervals to see the results.
Note that the default unit is a millisecond, so to create intervals of 5, 15 and 30 seconds, we need to enter 5000, 15000 and 30000.
We can also change the unit that is displayed in the report.
Click![]() and select Settings.
and select Settings.
In order to display our report in seconds, we need to change the Scale to 0.001 and change the unit name to sec.
Telerik Analytics uses a dot-notation, which gives you full control over the categories, groups and structure of your Analytics dashboard.
You can group your features at multiple levels i.e. Menu.Save.PDF + Menu.Save.JPG and then review the results at each level.
Coming up with the right names for feature tracking labels can be quite tricky. However, just like with a good function name, it is important to come up with something that is meaningful and easy to follow.
The final piece of the puzzle is Exception Tracking. In my opinion, this feature by itself is worth setting up Analytics in you mobile app.
Imagine having to get an error report from a smart device, owned by someone in a different city (or even country). Would you save the error to a log file and then explain to someone how to find the file and email it to you? Although this approach might work for some small desktop applications, for mobile apps this is a big NO! NO!
But do not despair. Capturing exception info is super easy with Analytics.
Just add a try and catch clause around the code that could potentially fail (to be honest you should be doing that even if you are not using analytics :P). And when the exception happens just call monitor.trackException(exceptionObject, "your message");
Switch to the TapChallenge tab.
To put this to test, add the following code at the bottom of the tapAction function (still located in the good old main-view-model.js). Run the app and go crazy tapping until you go over the 42 clicks.
if (this.counter < 0) {
alert("too many clicks");
try {
throw new Error("Too many clicks");
} catch (ex) {
monitor.trackException(ex, "Failed while clicking");
}
}
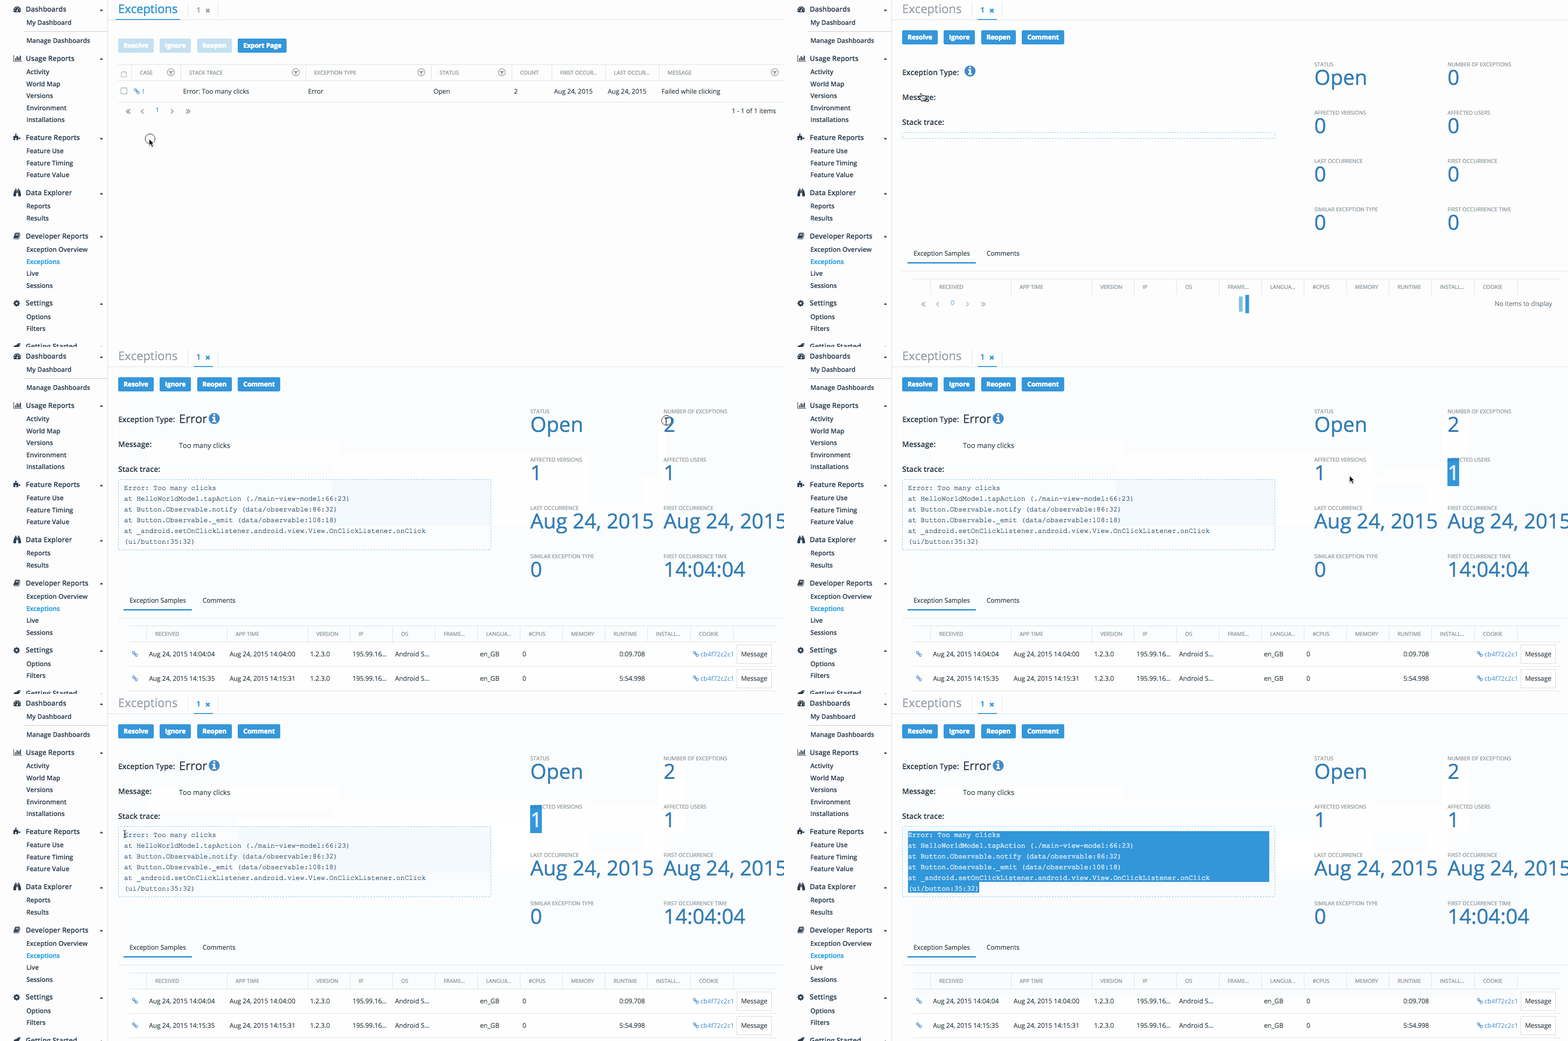
Switch to the TapChallengeAnalytics tab. Go to Developer Reports->Exceptions.
Click 1 in the CASE column. This will take you to the screen with the details of the exception. In here you can see the stack trace and other info like how many times this exception happened, in how many different versions and how many users were affected.
This can be very useful to determine where the problem is (i.e. Number of Exceptions=300 and Affected Users=200 this means this is an issue that affects a lot of people).
As a bonus you can use Analytics to report on all unhandled errors.
The best way to do that is by adding exception tracking to application uncaught error event.
Switch to the TapChallenge tab. Open app.js and paste the following code just before application.start(); .
application.on(application.uncaughtErrorEvent, function (args) {
var exception;
if (args.android)
exception = args.android;
else if (args.ios)
exception = args.ios;
monitor.trackException(exception, "Uncaught exception");
});
Now your app should be able to report even on unexpected errors.
In {N} 1.2 the uncaught error event is only available for iOS. It will be enabled for Android in version 1.3.
We have already implemented it in the master. Go and have a look if you like a bit of C++ before breakfast.